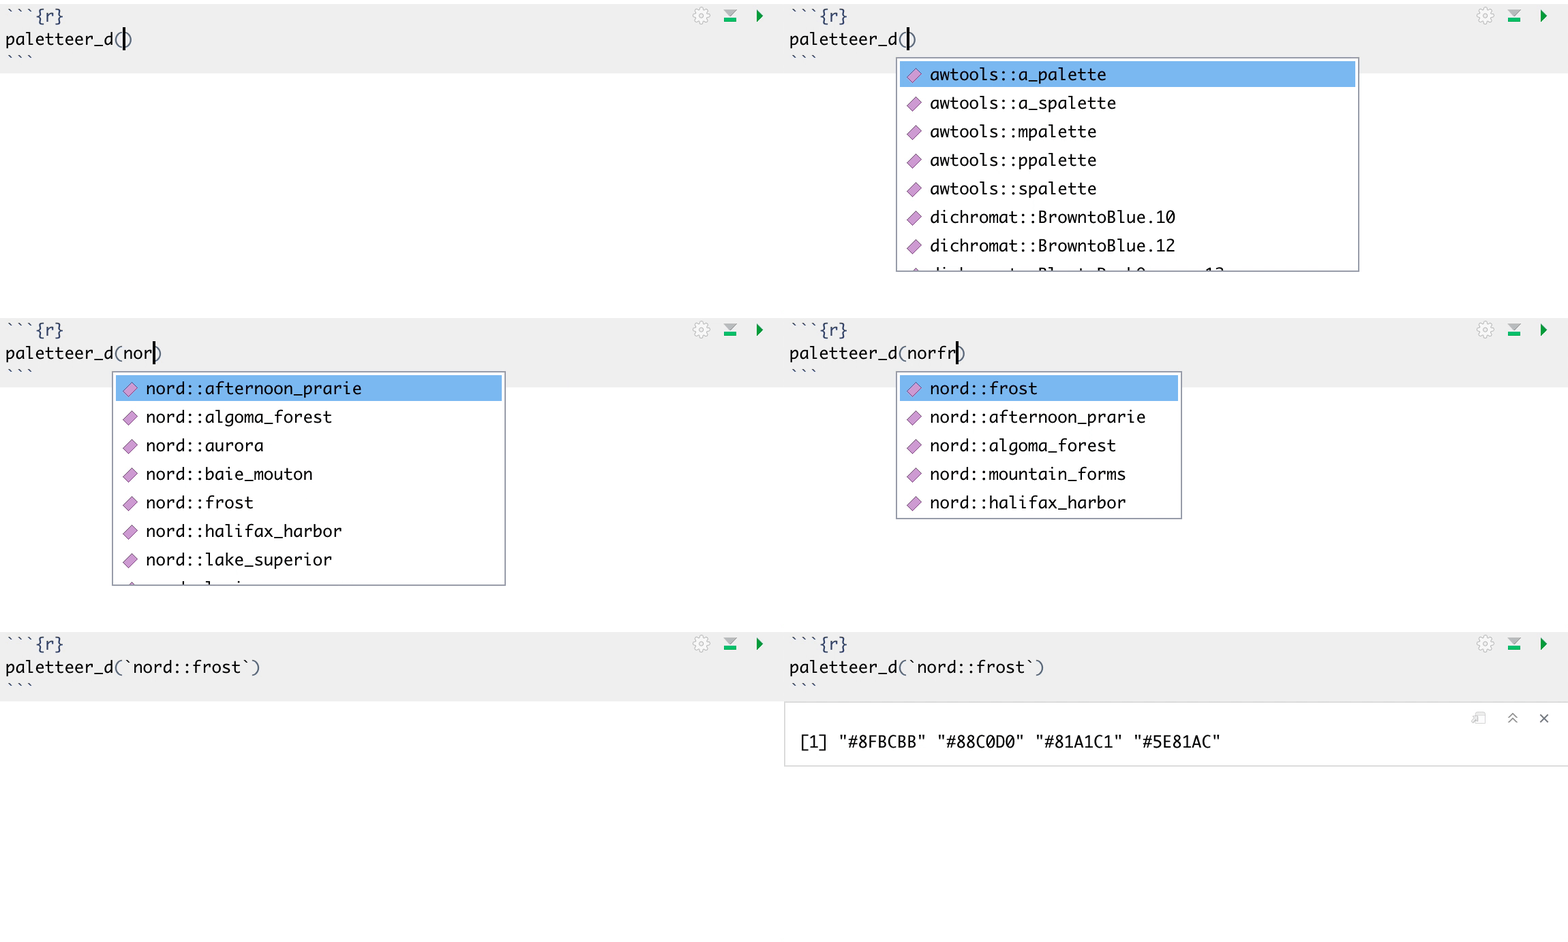
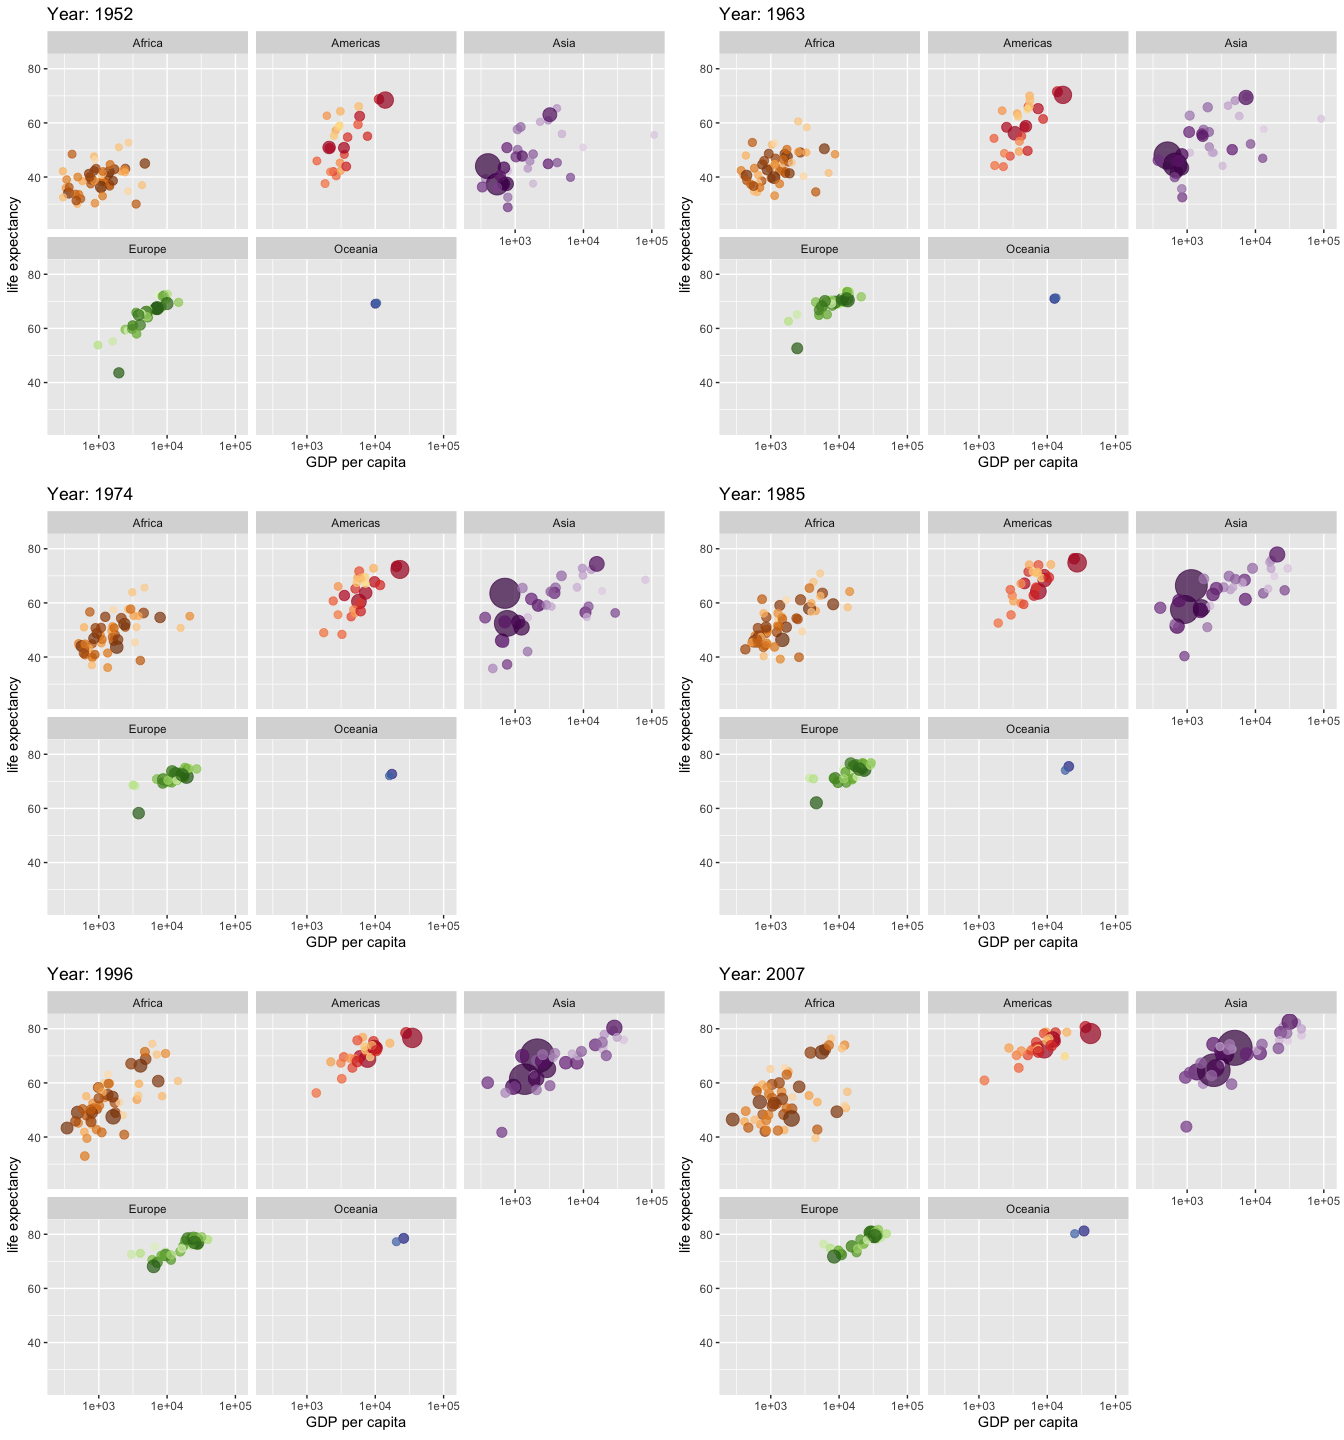
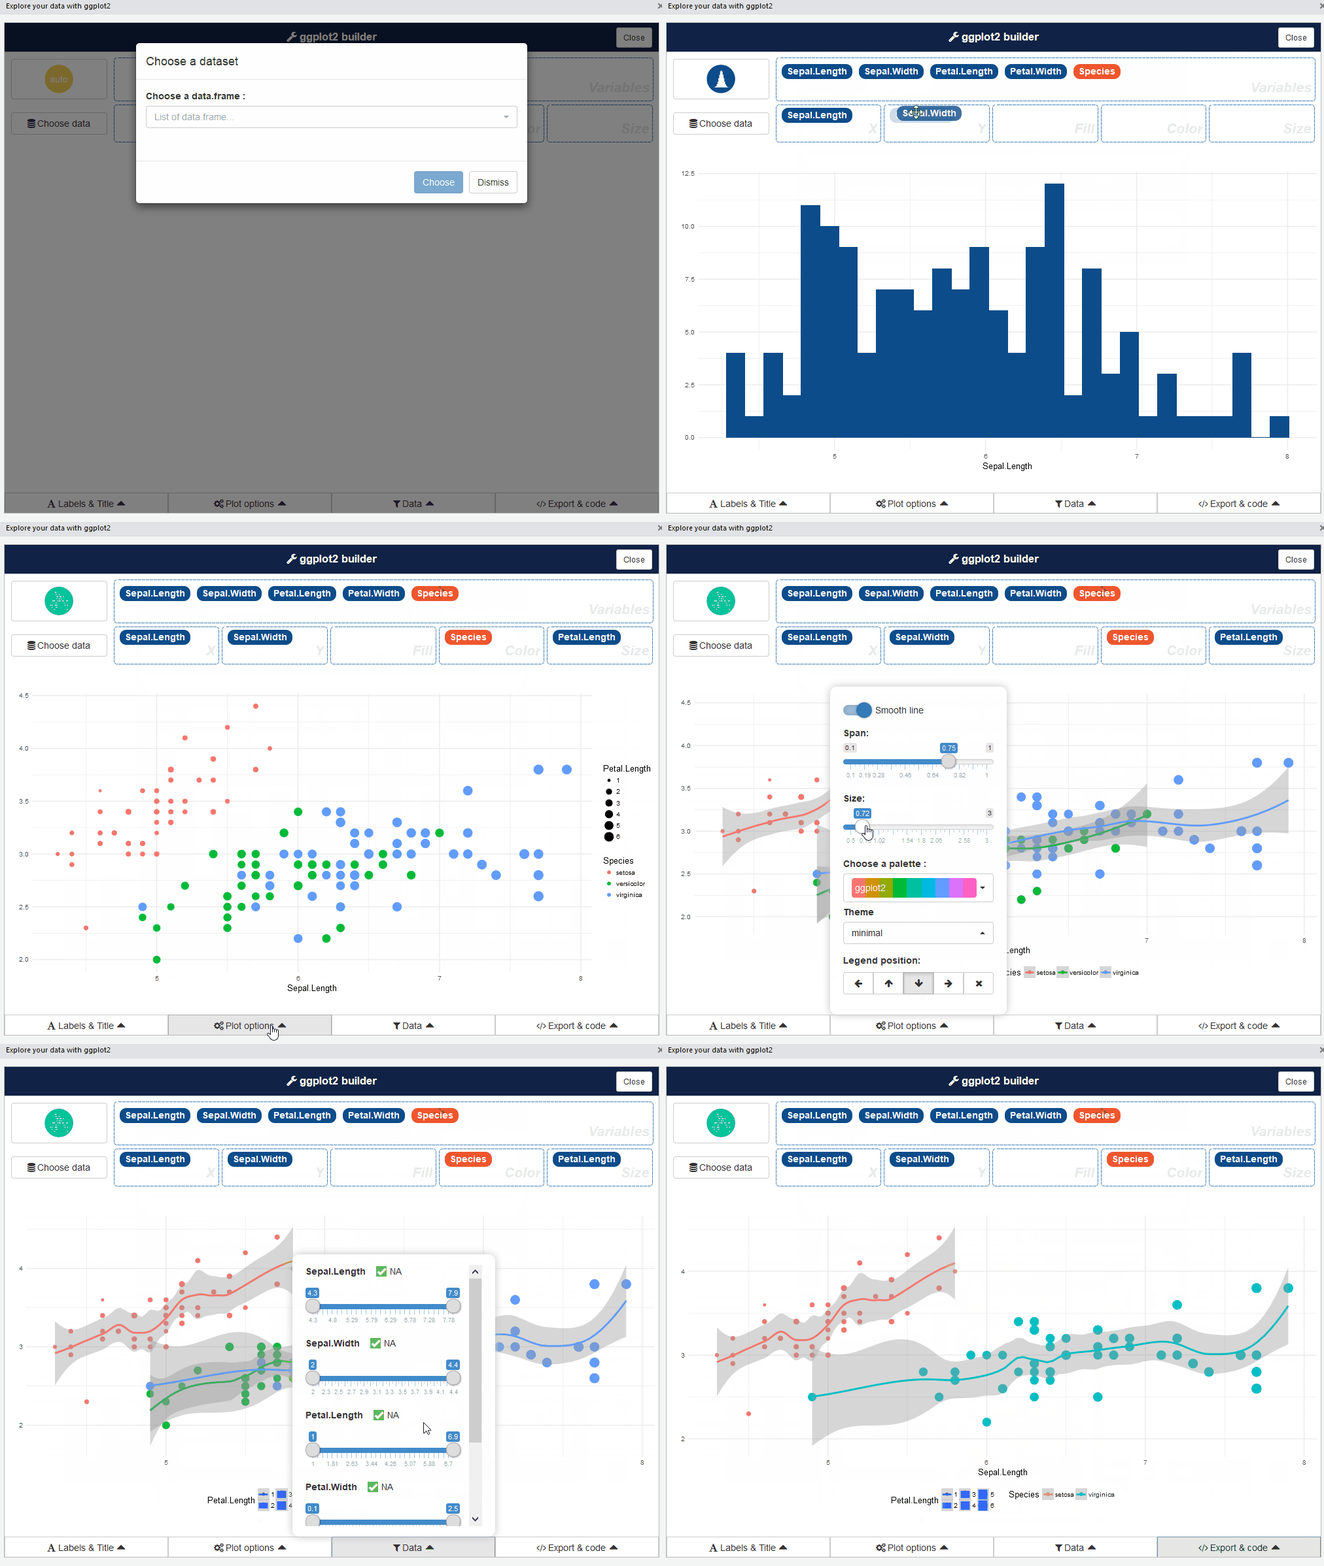
class: center, middle, title-slide # Data visualization with ggplot2 ## OCRUG Hackathon 2019-11 ### Emil Hvitfeldt ### 2019-11-09 --- .center[] --- # Overview - Structure - Aesthetics - Geometric objects - Position adjustments - Themes - Extensions --- # Data - mtcars ```r dplyr::glimpse(mtcars) ``` ``` ## Observations: 32 ## Variables: 11 ## $ mpg <dbl> 21.0, 21.0, 22.8, 21.4, 18.7, 18.1, 14.3, 24.4, 22.8, 19.2,… ## $ cyl <dbl> 6, 6, 4, 6, 8, 6, 8, 4, 4, 6, 6, 8, 8, 8, 8, 8, 8, 4, 4, 4,… ## $ disp <dbl> 160.0, 160.0, 108.0, 258.0, 360.0, 225.0, 360.0, 146.7, 140… ## $ hp <dbl> 110, 110, 93, 110, 175, 105, 245, 62, 95, 123, 123, 180, 18… ## $ drat <dbl> 3.90, 3.90, 3.85, 3.08, 3.15, 2.76, 3.21, 3.69, 3.92, 3.92,… ## $ wt <dbl> 2.620, 2.875, 2.320, 3.215, 3.440, 3.460, 3.570, 3.190, 3.1… ## $ qsec <dbl> 16.46, 17.02, 18.61, 19.44, 17.02, 20.22, 15.84, 20.00, 22.… ## $ vs <dbl> 0, 0, 1, 1, 0, 1, 0, 1, 1, 1, 1, 0, 0, 0, 0, 0, 0, 1, 1, 1,… ## $ am <dbl> 1, 1, 1, 0, 0, 0, 0, 0, 0, 0, 0, 0, 0, 0, 0, 0, 0, 1, 1, 1,… ## $ gear <dbl> 4, 4, 4, 3, 3, 3, 3, 4, 4, 4, 4, 3, 3, 3, 3, 3, 3, 4, 4, 4,… ## $ carb <dbl> 4, 4, 1, 1, 2, 1, 4, 2, 2, 4, 4, 3, 3, 3, 4, 4, 4, 1, 2, 1,… ``` ??? Fuel economy data from 1999 and 2008 for 38 popular models of car Description This dataset contains a subset of the fuel economy data that the EPA makes available on http://fueleconomy.gov. It contains only models which had a new release every year between 1999 and 2008 - this was used as a proxy for the popularity of the car --- # Structure .pull-left[ ```r library(ggplot2) ``` ```r ggplot(mtcars, aes(disp, mpg)) + geom_point() ``` ] .pull-right[ <img src="Untitled_files/figure-html/unnamed-chunk-5-1.png" width="700px" style="display: block; margin: auto;" /> ] --- # A graphing template ```r ggplot(data = <DATA>, mapping = aes(<MAPPINGS>)) + <GEOM_FUNCTION>() ``` -- - starts with `ggplot()` - geom function - mappings - composed with `+` instead of `%>%` --- # Aesthetics ## The mapping between the data and the graphical parameters ```r ggplot(mpg, aes(displ, hwy)) + geom_point() ``` the same as ```r ggplot(mpg, aes(x = displ, y = hwy)) + geom_point() ``` --- ```r ggplot(mpg, aes(displ, hwy)) + geom_point() ``` <img src="Untitled_files/figure-html/unnamed-chunk-9-1.png" width="700px" style="display: block; margin: auto;" /> --- ```r ggplot(mpg, aes(displ, hwy, size = cty)) + geom_point() ``` <img src="Untitled_files/figure-html/unnamed-chunk-10-1.png" width="700px" style="display: block; margin: auto;" /> --- ```r ggplot(mpg, aes(displ, hwy, color = cty)) + geom_point() ``` <img src="Untitled_files/figure-html/unnamed-chunk-11-1.png" width="700px" style="display: block; margin: auto;" /> --- ```r ggplot(mpg, aes(displ, hwy, color = class)) + geom_point() ``` <img src="Untitled_files/figure-html/unnamed-chunk-12-1.png" width="700px" style="display: block; margin: auto;" /> --- ```r ggplot(mpg, aes(displ, hwy, color = class, size = cty)) + geom_point() ``` <img src="Untitled_files/figure-html/unnamed-chunk-13-1.png" width="700px" style="display: block; margin: auto;" /> --- ```r ggplot(mpg) + geom_point(aes(displ, hwy, color = "blue")) ``` <img src="Untitled_files/figure-html/unnamed-chunk-14-1.png" width="700px" style="display: block; margin: auto;" /> --- # I want the color! ```r ggplot(mpg) + geom_point(aes(displ, hwy), color = "blue") ``` <img src="Untitled_files/figure-html/unnamed-chunk-15-1.png" width="700px" style="display: block; margin: auto;" /> --- # Geometric objects .pull-left[ All starts with `geom_` and adds a layer to your chart ```r ggplot(mpg, aes(displ, hwy)) + geom_point() + * geom_smooth() ``` ] .pull-right[ ``` ## `geom_smooth()` using method = 'loess' and formula 'y ~ x' ``` <img src="Untitled_files/figure-html/unnamed-chunk-17-1.png" width="700px" style="display: block; margin: auto;" /> ] --- # Geoms - 1 variable ```r ggplot(mpg, aes(displ)) + geom_density() ``` <img src="Untitled_files/figure-html/unnamed-chunk-18-1.png" width="700px" style="display: block; margin: auto;" /> --- # Geoms - 1 variable ```r ggplot(mpg, aes(displ)) + * geom_dotplot(binwidth = 0.1) ``` <img src="Untitled_files/figure-html/unnamed-chunk-19-1.png" width="700px" style="display: block; margin: auto;" /> --- # Geoms - 1 variable ```r ggplot(mpg, aes(displ)) + * geom_histogram(binwidth = 0.1) ``` <img src="Untitled_files/figure-html/unnamed-chunk-20-1.png" width="700px" style="display: block; margin: auto;" /> --- # Geoms - 1 variable ```r ggplot(mpg, aes(displ)) + * geom_histogram(binwidth = 0.3) ``` <img src="Untitled_files/figure-html/unnamed-chunk-21-1.png" width="700px" style="display: block; margin: auto;" /> --- ```r ggplot(mpg, aes(displ, hwy)) + geom_point() + geom_smooth() ``` ``` ## `geom_smooth()` using method = 'loess' and formula 'y ~ x' ``` <img src="Untitled_files/figure-html/unnamed-chunk-22-1.png" width="700px" style="display: block; margin: auto;" /> --- ```r ggplot(mpg, aes(displ, hwy, color = drv)) + geom_point() + geom_smooth() ``` ``` ## `geom_smooth()` using method = 'loess' and formula 'y ~ x' ``` <img src="Untitled_files/figure-html/unnamed-chunk-23-1.png" width="700px" style="display: block; margin: auto;" /> --- ```r ggplot(mpg, aes(displ, hwy)) + geom_point(aes(color = drv)) + geom_smooth() ``` ``` ## `geom_smooth()` using method = 'loess' and formula 'y ~ x' ``` <img src="Untitled_files/figure-html/unnamed-chunk-24-1.png" width="700px" style="display: block; margin: auto;" /> --- ```r ggplot(mpg, aes(displ, hwy)) + geom_point() + geom_smooth(aes(color = drv)) ``` ``` ## `geom_smooth()` using method = 'loess' and formula 'y ~ x' ``` <img src="Untitled_files/figure-html/unnamed-chunk-25-1.png" width="700px" style="display: block; margin: auto;" /> --- # Position adjustments ```r ggplot(mpg, aes(drv)) + geom_bar() ``` <img src="Untitled_files/figure-html/unnamed-chunk-26-1.png" width="700px" style="display: block; margin: auto;" /> --- ```r ggplot(mpg, aes(drv, color = fl)) + geom_bar() ``` <img src="Untitled_files/figure-html/unnamed-chunk-27-1.png" width="700px" style="display: block; margin: auto;" /> --- ```r ggplot(mpg, aes(drv, fill = fl)) + geom_bar() ``` <img src="Untitled_files/figure-html/unnamed-chunk-28-1.png" width="700px" style="display: block; margin: auto;" /> --- ```r ggplot(mpg, aes(drv, fill = fl)) + geom_bar(position = "fill") ``` <img src="Untitled_files/figure-html/unnamed-chunk-29-1.png" width="700px" style="display: block; margin: auto;" /> --- ```r ggplot(mpg, aes(drv, fill = fl)) + geom_bar(position = "dodge") ``` <img src="Untitled_files/figure-html/unnamed-chunk-30-1.png" width="700px" style="display: block; margin: auto;" /> --- # Facets ```r ggplot(mpg, aes(displ, hwy)) + geom_point() + facet_wrap(~drv) ``` <img src="Untitled_files/figure-html/unnamed-chunk-31-1.png" width="700px" style="display: block; margin: auto;" /> --- ```r ggplot(mpg, aes(displ, hwy)) + geom_point() + facet_grid(drv ~ fl) ``` <img src="Untitled_files/figure-html/unnamed-chunk-32-1.png" width="700px" style="display: block; margin: auto;" /> --- ```r ggplot(mpg, aes(displ, hwy)) + geom_point() + facet_grid(drv ~ fl) + geom_smooth(method = "lm", se = FALSE) ``` <img src="Untitled_files/figure-html/unnamed-chunk-33-1.png" width="700px" style="display: block; margin: auto;" /> --- # Themes All starts with `theme_` --- ```r ggplot(mpg, aes(drv, fill = fl)) + geom_bar(position = "dodge") + * theme_minimal() ``` <img src="Untitled_files/figure-html/unnamed-chunk-34-1.png" width="700px" style="display: block; margin: auto;" /> --- # Recommend: ggthemr and ggthemes ```r install.packages("ggthemes") remotes::install_github("cttobin/ggthemr") ``` ---  ---  ---  ---  --- ```r ggplot(mpg, aes(drv, fill = fl)) + geom_bar(position = "dodge") + theme_minimal() + * labs(title = "this is a fancy title", * subtitle = "and subtitle", * x = "Type of Drive", * fill = "Fuel type") ``` <img src="Untitled_files/figure-html/unnamed-chunk-36-1.png" width="700px" style="display: block; margin: auto;" /> --- ```r ggplot(mpg, aes(drv, fill = fl)) + geom_bar(position = "dodge") + theme_minimal() + labs(title = "this is a fancy title", subtitle = "and subtitle", x = "Type of Drive", fill = "Fuel type") + scale_fill_brewer(palette = "Set2") ``` <img src="Untitled_files/figure-html/unnamed-chunk-37-1.png" width="700px" style="display: block; margin: auto;" /> --- ```r library(paletteer) ggplot(mpg, aes(drv, fill = fl)) + geom_bar(position = "dodge") + theme_minimal() + labs(title = "this is a fancy title", subtitle = "and subtitle", x = "Type of Drive", fill = "Fuel type") + scale_fill_paletteer_d("nord::aurora") ``` <img src="Untitled_files/figure-html/unnamed-chunk-38-1.png" width="700px" style="display: block; margin: auto;" /> --- # Use dev version of paletteer <img src='https://raw.githubusercontent.com/EmilHvitfeldt/paletteer/master/man/figures/logo.png' align="right" height="100" /> ```r remotes::install_github("EmilHvitfeldt/paletteer") ```  --- .small[ ```r methods::formalArgs(theme) ``` ``` ## [1] "line" "rect" ## [3] "text" "title" ## [5] "aspect.ratio" "axis.title" ## [7] "axis.title.x" "axis.title.x.top" ## [9] "axis.title.x.bottom" "axis.title.y" ## [11] "axis.title.y.left" "axis.title.y.right" ## [13] "axis.text" "axis.text.x" ## [15] "axis.text.x.top" "axis.text.x.bottom" ## [17] "axis.text.y" "axis.text.y.left" ## [19] "axis.text.y.right" "axis.ticks" ## [21] "axis.ticks.x" "axis.ticks.x.top" ## [23] "axis.ticks.x.bottom" "axis.ticks.y" ## [25] "axis.ticks.y.left" "axis.ticks.y.right" ## [27] "axis.ticks.length" "axis.ticks.length.x" ## [29] "axis.ticks.length.x.top" "axis.ticks.length.x.bottom" ## [31] "axis.ticks.length.y" "axis.ticks.length.y.left" ## [33] "axis.ticks.length.y.right" "axis.line" ## [35] "axis.line.x" "axis.line.x.top" ## [37] "axis.line.x.bottom" "axis.line.y" ## [39] "axis.line.y.left" "axis.line.y.right" ## [41] "legend.background" "legend.margin" ## [43] "legend.spacing" "legend.spacing.x" ## [45] "legend.spacing.y" "legend.key" ## [47] "legend.key.size" "legend.key.height" ## [49] "legend.key.width" "legend.text" ## [51] "legend.text.align" "legend.title" ## [53] "legend.title.align" "legend.position" ## [55] "legend.direction" "legend.justification" ## [57] "legend.box" "legend.box.just" ## [59] "legend.box.margin" "legend.box.background" ## [61] "legend.box.spacing" "panel.background" ## [63] "panel.border" "panel.spacing" ## [65] "panel.spacing.x" "panel.spacing.y" ## [67] "panel.grid" "panel.grid.major" ## [69] "panel.grid.minor" "panel.grid.major.x" ## [71] "panel.grid.major.y" "panel.grid.minor.x" ## [73] "panel.grid.minor.y" "panel.ontop" ## [75] "plot.background" "plot.title" ## [77] "plot.subtitle" "plot.caption" ## [79] "plot.tag" "plot.tag.position" ## [81] "plot.margin" "strip.background" ## [83] "strip.background.x" "strip.background.y" ## [85] "strip.placement" "strip.text" ## [87] "strip.text.x" "strip.text.y" ## [89] "strip.switch.pad.grid" "strip.switch.pad.wrap" ## [91] "..." "complete" ## [93] "validate" ``` ] --- # Extensions http://www.ggplot2-exts.org/gallery/ --- # gganimate <img src='https://gganimate.com/reference/figures/logo.png' align="right" height="100" />  --- # esquisse <img src='https://raw.githubusercontent.com/dreamRs/esquisse/master/man/figures/logo_esquisse.png' align="right" height="100" /> --- .center[  ] --- # Patchwork <img src='https://raw.githubusercontent.com/thomasp85/patchwork/master/man/figures/logo.png' align="right" height="100" /> ```r devtools::install_github("thomasp85/patchwork") ``` --- ```r library(patchwork) p1 <- ggplot(mtcars) + geom_point(aes(mpg, disp)) p2 <- ggplot(mtcars) + geom_boxplot(aes(gear, disp, group = gear)) p1 + p2 ``` <img src="Untitled_files/figure-html/unnamed-chunk-42-1.png" width="700px" style="display: block; margin: auto;" /> --- .center[  ] ??? https://timogrossenbacher.ch/2016/12/beautiful-thematic-maps-with-ggplot2-only/ --- .center[  ] ??? https://rpubs.com/bradleyboehmke/weather_graphic